


Introduction
Kubernetes monitoring is a critical component of managing containerized applications, enabling organizations to track the health and performance of their workloads, nodes, and clusters for better operational visibility. Effective Kubernetes monitoring involves the collection and analysis of metrics related to resource utilization, application performance, and container health, allowing operators to proactively address issues and optimize their infrastructure.
By default the Kubernetes Dashboard is a tool that we can use to monitor all theses things. It provides a user-friendly interface for real-time monitoring and management of your Kubernetes clusters, making it easier to keep a close eye on your containerized applications. By integrating the Kubernetes Dashboard into your monitoring stack, you can streamline the process of visualizing and analyzing performance metrics, ensuring that your Kubernetes infrastructure operates efficiently and reliably.
However, Kubernetes monitoring solutions offer a wide range of tools and techniques. One of the most popular is Prometheus and Grafana, which help teams gain insights into their Kubernetes environment, ensuring reliable and efficient operation of containerized applications.
In reality Prometheus + Grafana setup is more likely to happen in your production environment rather than Kubernetes Dashboard implementation. This is actually what I would like to show you and present how we can deploy this kind of monitoring for Kubernetes cluster.
What is Prometheus?
Prometheus is an open-source monitoring tool, offering pre-built monitoring features tailored for the Kubernetes container orchestration platform. It has the capability to monitor both servers and databases.
Prometheus collects and retains metrics as time-series data, associating each piece of information with a timestamp. It operates on a “pull” model, retrieving metrics from designated targets by accessing their HTTP endpoints for metric scraping. Within a Kubernetes environment, Prometheus plays a crucial role in metrics-driven monitoring and alerting as well.
What is Grafana?
Grafana is also an open source visualization and analytics software. It is basically responsible for data visualization, but also allows you to query, alert on, and explore metrics no matter where they are stored.
Deploy Monitoring for Kubernetes
Our plan is to have infrastructure installed as presented in below drawing.
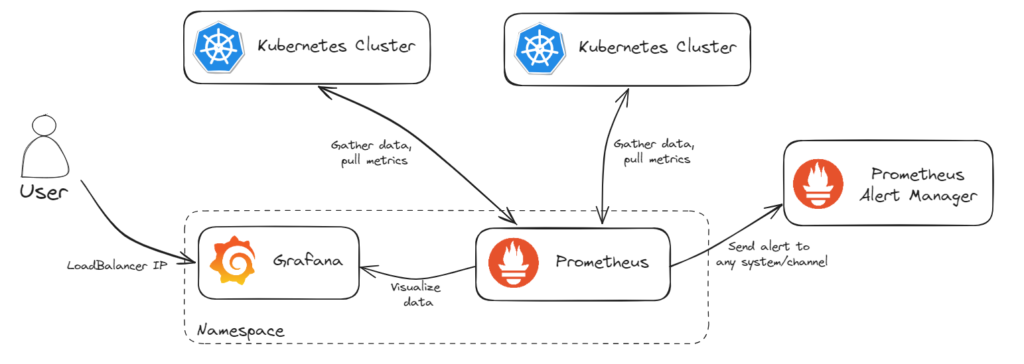
Recommended installation way is Helm and we will do it that way. Why? Helm simplifies the installation of all components in one command. Install using Helm is recommended as you will not miss any configuration steps and will do it quickly and without any problem.
Of course I assume you have already Helm package installed, if not
In order to install our Prometheus and Grafana we need to add the Helm Stable Charts and Prometheus repo. To do so execute the below commands:
$ helm repo add stable https://charts.helm.sh/stable
$ helm repo add prometheus-community https://prometheus-community.github.io/helm-charts
Prometheus and Grafana charts were moved to “kube-prometheus-stack” so we can validate if we see that, once we have added above repos:
$ helm search repo prometheus-community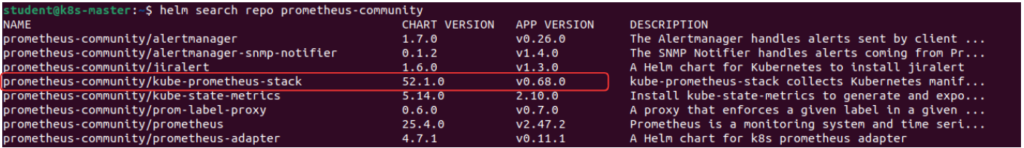
If you install older version you can find this under formerly name: “prometheus-operator“.
To provide logical separation of our monitoring tools I will create a dedicated namespace for it called “monitoring“:
$ kubectl create ns monitoringNext step is to install “kube-prometheus-stack“. Prometheus comes with a Grafana deployment embedded, so we don’t need to worry about anything more, just execute one command:
$ helm install stable prometheus-community/kube-prometheus-stack -n monitoring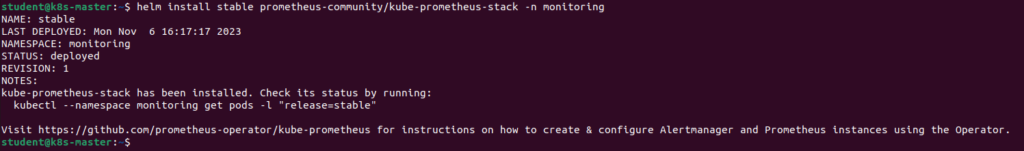
Let’s check if Pods and Services for our monitoring stack are running:
$ kubectl get svc,pods -n monitoring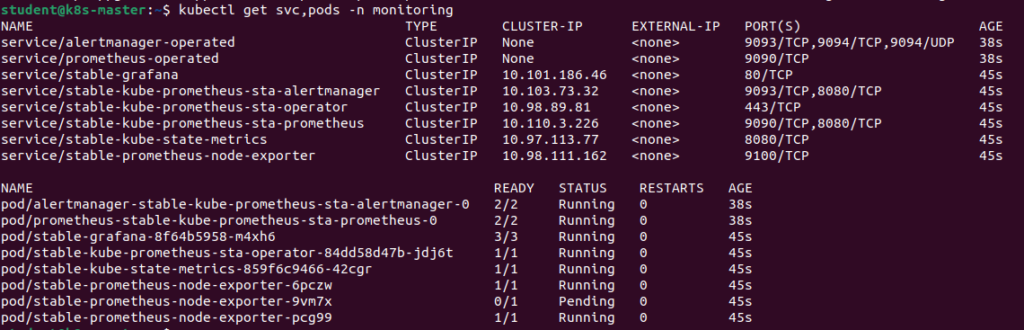
Statuses are fine, all is as expected. This confirms that Prometheus and Grafana have been installed successfully using Helm.
By default this setup is only available inside the cluster, so to make our Grafana UI available outside the cluster, I will change the service type to LoadBalancer with predefined IP address. You can also update it to NodePort instead of ClusterIP. Of course it will also work too.
$ kubectl edit svc stable-grafana -n monitoring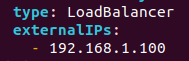
Check if IP address is assigned correctly indeed:
$ kubectl get svc stable-grafana -n monitoring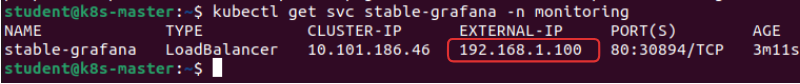
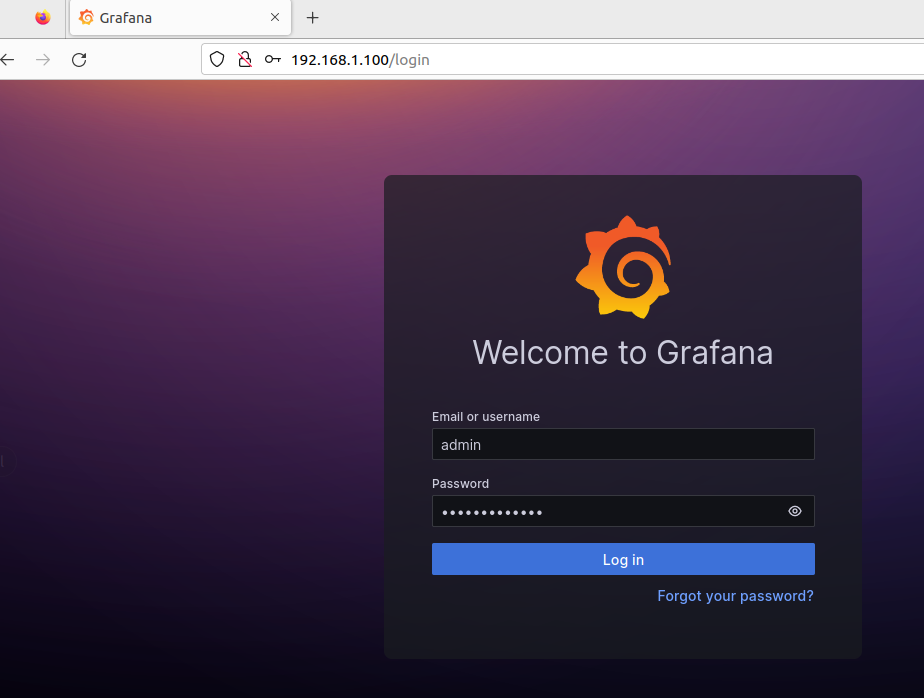
All is set now. Let’s open my LoadBalancer IP via web broswer: http://192.168.1.100 and login using the default username and password. However, you can create new users and update passwords later. Use the default credentials for now:
username: admin
password: prom-operator
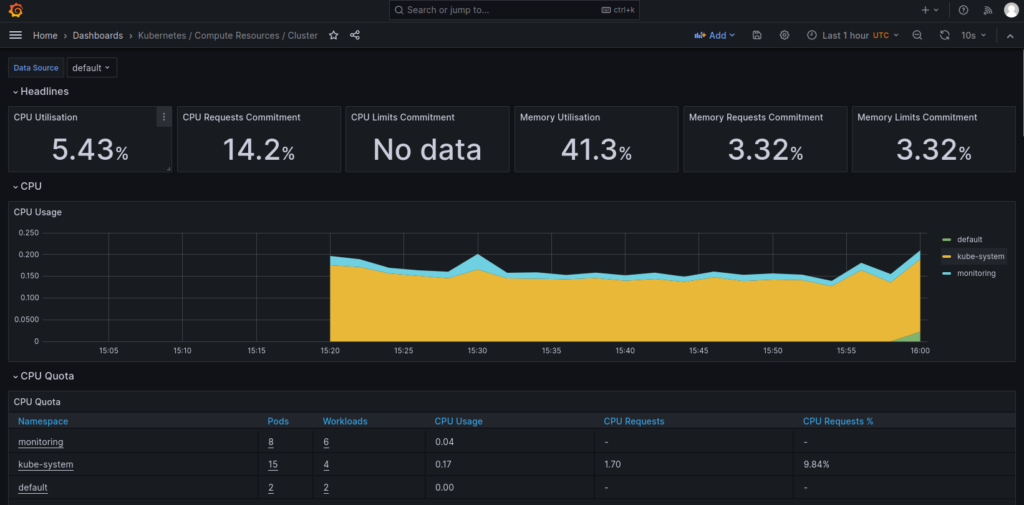
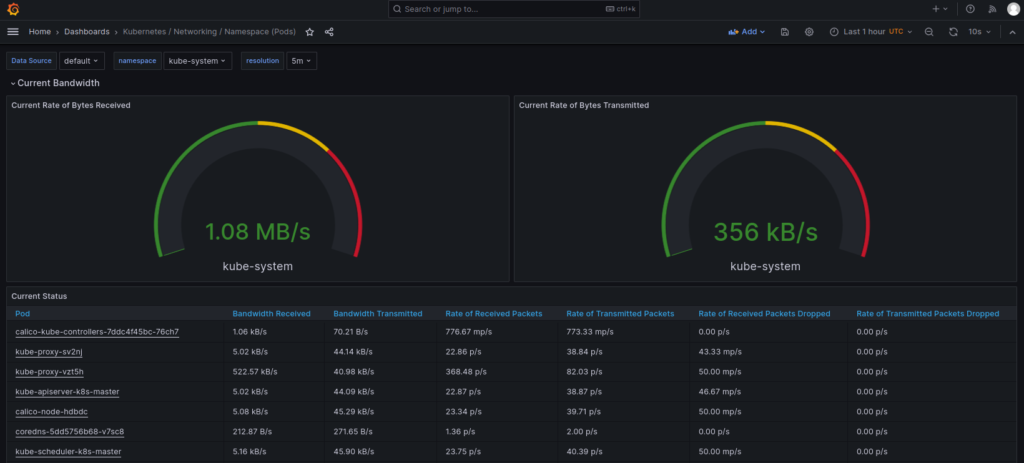
Once we are inside the Grafana web UI, there are a lot of things you can do. You can set the duration of scraping metrics. You can also configure your dashboard or look into networking. There are lots of dashboards provided by default, you can explore them on your own, to look at them just navigate into “Home” > “Dashboards” and then go to “General”. Here you find all predefined dashboard ready to use.
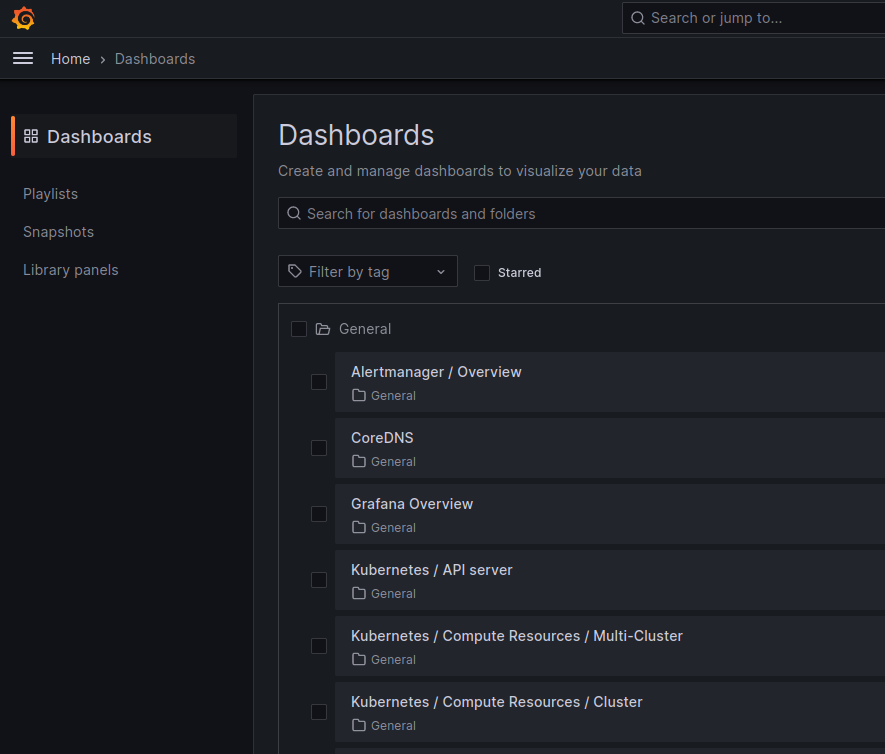
Below you can see some examples:
- Compute Resources for Kubernetes cluster
- Network statistics for Kubernetes Namespace
And many, many more.
There are a lot more things to explore in this but of course will not touch all of them now. My priority is to use it mainly to monitor the Kubernetes cluster so will focus on creating few useful dashboards.
Create Grafana Dashboards
To create a dashboard we do not need to do it from scratch, we can use import option instead and take advantage of already created stuff. I would present here how to create two useful dashboards:
- Kubernetes Monitoring Dashboard (id 12740) – general one for whole K8s cluster monitoring, showing CPU/memory/filesystem usage for cluster but also details for containers
- Kubernetes Pod Metrics Dashboard (id 747) – summary about individual Pods, containers and systemd services statistics
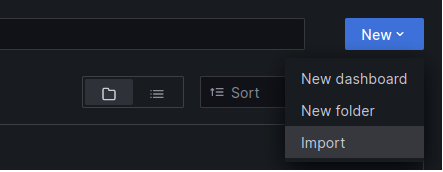
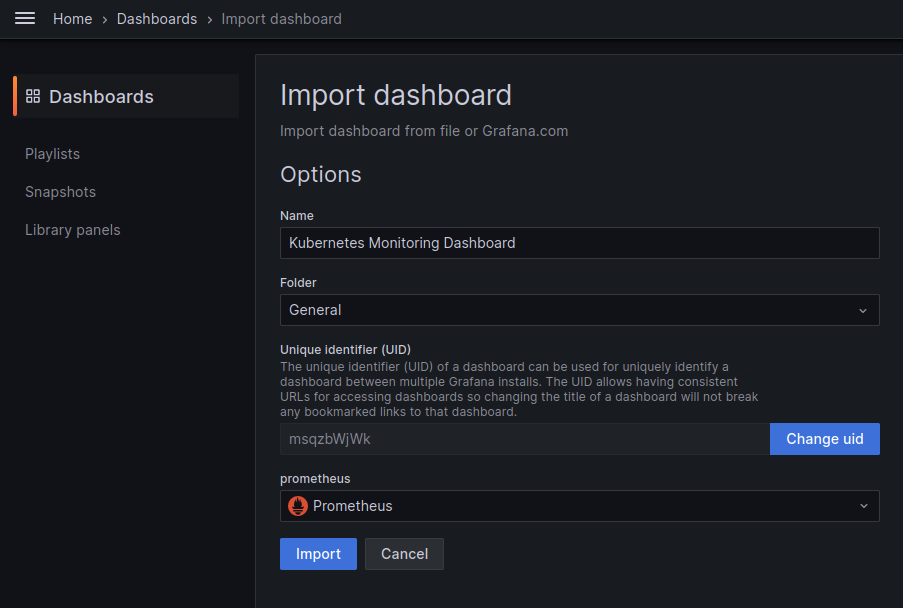
To import the dashboard, on the right hand side under “Dashboards” click “New” button and select “Import”.
Enter dashboard ID from Grafana.com (i.e. 12740) or paste the JSON for particular dashboard – you can copy it also from the same site.
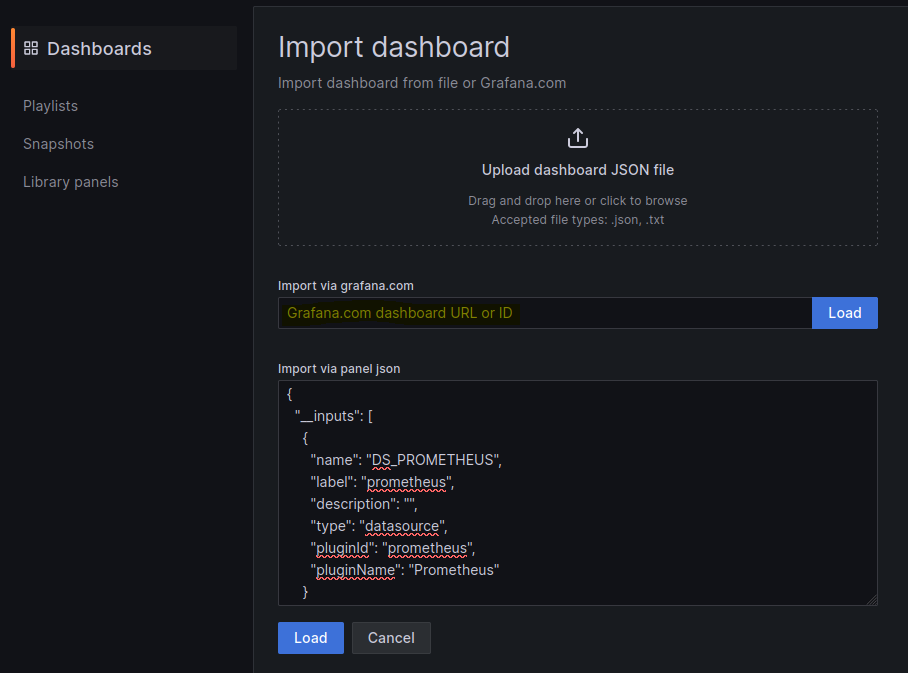
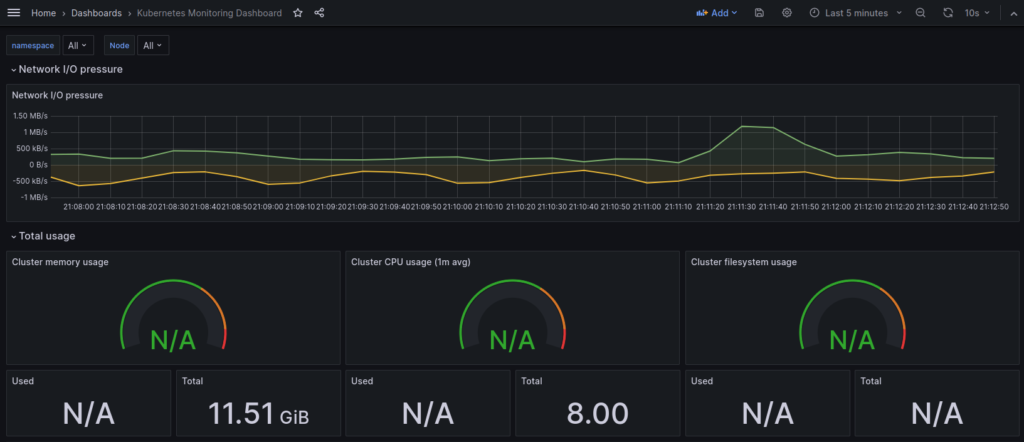
Click “Load”. Select “Prometheus” as the endpoint under prometheus data sources drop down and click “Import”. This will show monitoring dashboard for all cluster nodes.
When you import it successfully you should see screen similar to this one:
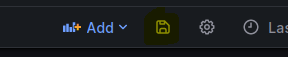
Finally we can save the dashboard otherwise we will loose the changes if we adjusted it to our needs. To do so, please click on the “Save” icon on the top menu:
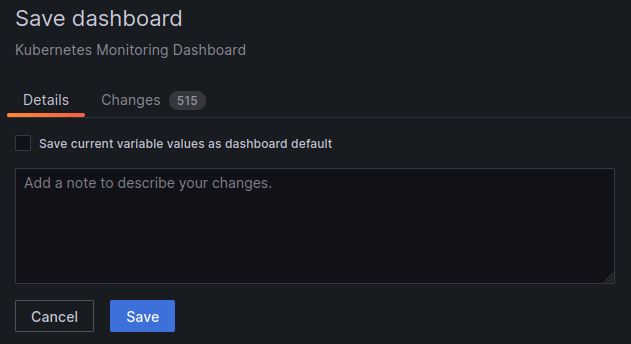
And then double confirm the save by clicking “Save” button. Optionally we can add some comments here if needed.
Second dashboard for Pod monitoring I created doing same steps. I followed exactly the same procedure, so I used “Import” button and provided ID 747 and another dashboard was imported quickly and without any problems.
That’s it, hope you enjoy it.
Conclusion
Implementing Kubernetes monitoring with Prometheus and Grafana provides a lot of advantages and gives you deep insights into the performance and health of your clusters for sure. I hope you understand that Kubernetes monitoring is not just comprehensive but adaptable and we can do it quite easy and fast. I truly believe that after reading this post you will be familiar with basic concept of how these tools work seamlessly together and will be able to enable efficient monitoring, troubleshooting and resource optimization into your environments. As I explore the dashboards and showed you how to use and import even external ones, you should not have any issues with doing proactive management within your K8s cluster. Keep calm and use proper mechanism for your Kubernetes workloads monitoring.